WATER RATES

Water consumers are also classified depending on the presence and nature of the economic activity in their house or establishment. Their classification determines what type of water rates will be applied to them, i.e. Residential, Government and Commercial.

IMPLEMENTED WATER RATES

Cubic Meters Consumed Residential

Rate

Government

Rate

Commercial

Rate

Minimum (1-10) 288.00 460.80 576.00
11-20 32.00 32.00 64.00
21-30 34.90 34.90 69.80
31-40 37.85 37.85 75.70
40- UP 40.75 40.75 81.50

SUMMARY REPORT ON PHYSICAL AND CHEMICAL TEST

Conducting Physical and Chemical tests

a number of chemical and physical test can be
conducted to measure water quality. This
section explains the procedures you need to
use to assess the quality of the water at your test side.
Some of these tests involve chemicals.
You also need to measure the physical conditions of the water.

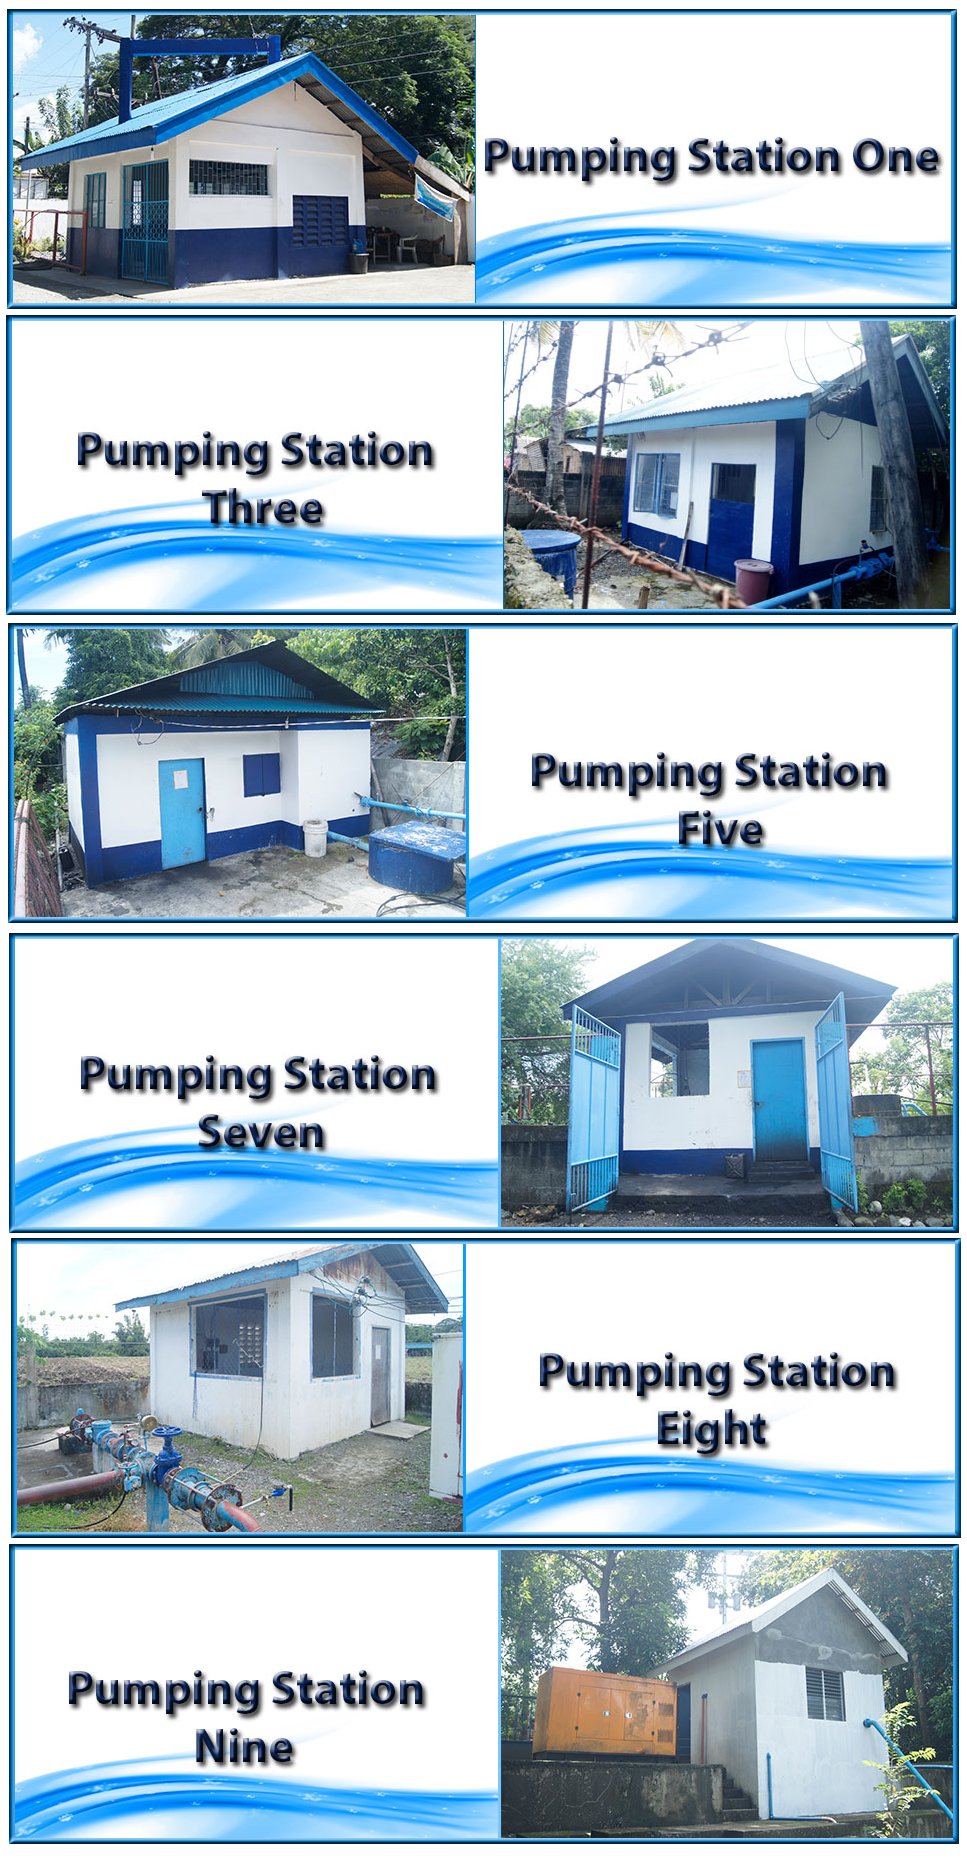
Pumping Station No. 9

Date: June 23, 2014

Physical:

Apparent Color:  0

Turbidity:            0

Odor:              UO

Chemical:

Chloride:                    18

Total Hardness:        320

pH:                            6.3

Total Solids:              328

Residual Chlorine: NIL
Calcium:                    44.39

Magnesium:              50.75

Sulfate:                      39.50

Silica:                        217.50


Pumping Station No. 8

Date: June 23, 2014

Physical:

 Apparent Color:        0

Turbidity:                    0

Odor:                         UO

Chemical:

Chloride:                    50

Total Hardness:        384

pH:                              6.8

Total Solids:              538

Residual Chlorine: NIL
Calcium:                    49.70

Magnesium:              56.12

Sulfate:                      115

Silica:                         134


Pumping Station No. 5

Date: June 23, 2014

Physical:

Apparent Color:        0

Turbidity:                  0

Odor:                        UO

Chemical:

Chloride:                    10

Total Hardness:        276

pH:                            6.7

Total Solids:              376

Residual Chlorine: NIL
Calcium:                    39.28

Magnesium:              43.43

Sulfate:                      66.0

Silica:                      125


Pumping Station No. 7

Date: October 27, 2014

Physical:

Apparent Color:        0

Turbidity:                  0

Odor:                        UO

Chemical:

Chloride:                    22

Total Hardness:        352

pH:                             6.7

Total Solids:             538

Residual Chlorine: 0.2
Calcium:                    96.19

Magnesium:             27.33

Sulfate:                    70.25

Silica:                       93.0


Pumping Station No. 1

Date: October 27, 2014

Physical:

Apparent Color:         0

Turbidity:                    0

Odor:                          UO

Chemical:

Chloride:                    28

Total Hardness:        272

pH:                              6.7

Total Solids:              234

Residual Chlorine: NIL
Calcium:                    76.15

Magnesium:              123.63

Sulfate:                      55.25

Silica:                        93.0


Pumping Station No. 3

Date: October 27, 2014

 Physical:

Apparent Color:         0

Turbidity:                    0

Odor:                          UO

Chemical:

Chloride:                    14

Total Hardness:        328

pH:                              6.7

Total Solids:              492

Residual Chlorine: NIL
Calcium:                    92.18

Magnesium:              23.91

Sulfate:                      68.0

Silica:                          96.0


SUMMARY REPORT ON BACTERIOLOGICAL TEST

PUMPING  STATION NO. 5


Date


Total Coliforms


Fecal Coliforms

Heterotrophic Plate Count Cfu/Ml  

Remarks

January 13, 2015 <1.1 <1.1 0 Passed
March 11, 2014 <1.1 <1.1 0 Passed
April, 7, 2014 <1.1 <1.1 0 Passed
July 21, 2014 <1.1 <1.1 0 Passed
September 22,2014 <1.1 <1.1 0 Passed
October 27, 2014 <1.1 <1.1 0 Passed


PUMPING  STATION NO. 7


Date


Total Coliforms


Fecal Coliforms

Heterotrophic Plate Count Cfu/Ml  

Remarks

February 18, 2014 <1.1 <1.1 12 Passed
March 11, 2014 <1.1 <1.1 0 Passed
April, 7, 2014 <1.1 <1.1 0 Passed
July 21, 2014 <1.1 <1.1 0 Passed
August 26, 2014 <1.1 <1.1 0 Passed
October 27, 2014 2.6 <1.1 0 Passed
November 25, 2014 <1.1 <1.1 0 Passed


PUMPING   STATION NO. 8


Date


Total Coliforms


Fecal Coliforms

Heterotrophic Plate Count Cfu/Ml  

Remarks

January 13, 2015 <1.1 <1.1 0 Passed
February 18, 2014 <1.1 <1.1 0 Passed
March 11, 2014 <1.1 <1.1 0 Passed
April, 7, 2014 <1.1 <1.1 0 Passed
May 19, 2014 <1.1 <1.1 0 Passed
July 21, 2014 <1.1 <1.1 0 Passed
August 26, 2014 <1.1 <1.1 0 Passed
November 25, 2014 <1.1 <1.1 25 Passed


PUMPING STATION NO. 9


Date


Total Coliforms


Fecal Coliforms

Heterotrophic Plate Count Cfu/Ml  

Remarks

January 13, 2015 <1.1 <1.1 0 Passed
February 18, 2014 <1.1 <1.1 0 Passed
March 11, 2014 <1.1 <1.1 0 Passed
April, 7, 2014 <1.1 <1.1 0 Passed
June 9, 2014 <1.1 <1.1 0 Passed
July 21, 2014 <1.1 <1.1 0 Passed
September 22,2014 <1.1 <1.1 0 Passed

WATER PRODUCTION


WATER PRODUCTION

PUMPING STATIONS NOVEMBER DECEMBER JANUARY FEBRUARY
1 4, 484 3, 494 4, 545 2, 729
3 9, 450 11, 352 7, 630 6, 655
5 7, 459 4, 769 8, 902
7 7, 459 5, 322 12, 518 7, 501
8 21, 633 15, 176 13, 212 6, 243
9 20, 406 13, 281 27, 755 10, 063
TOTAL 63, 432 48, 625 70, 429 42, 093